This is an update on my research and I will try to post more often in these last months of my Marie Curie Fellowship. Files are hosted on my github page. Data have been collected by Alain Crivelli and Dušan Jesenšek since 1996. Some info on marble trout, the conservation program, and Western Slovenian streams here below.
1. Marble trout and Western Slovenian streams
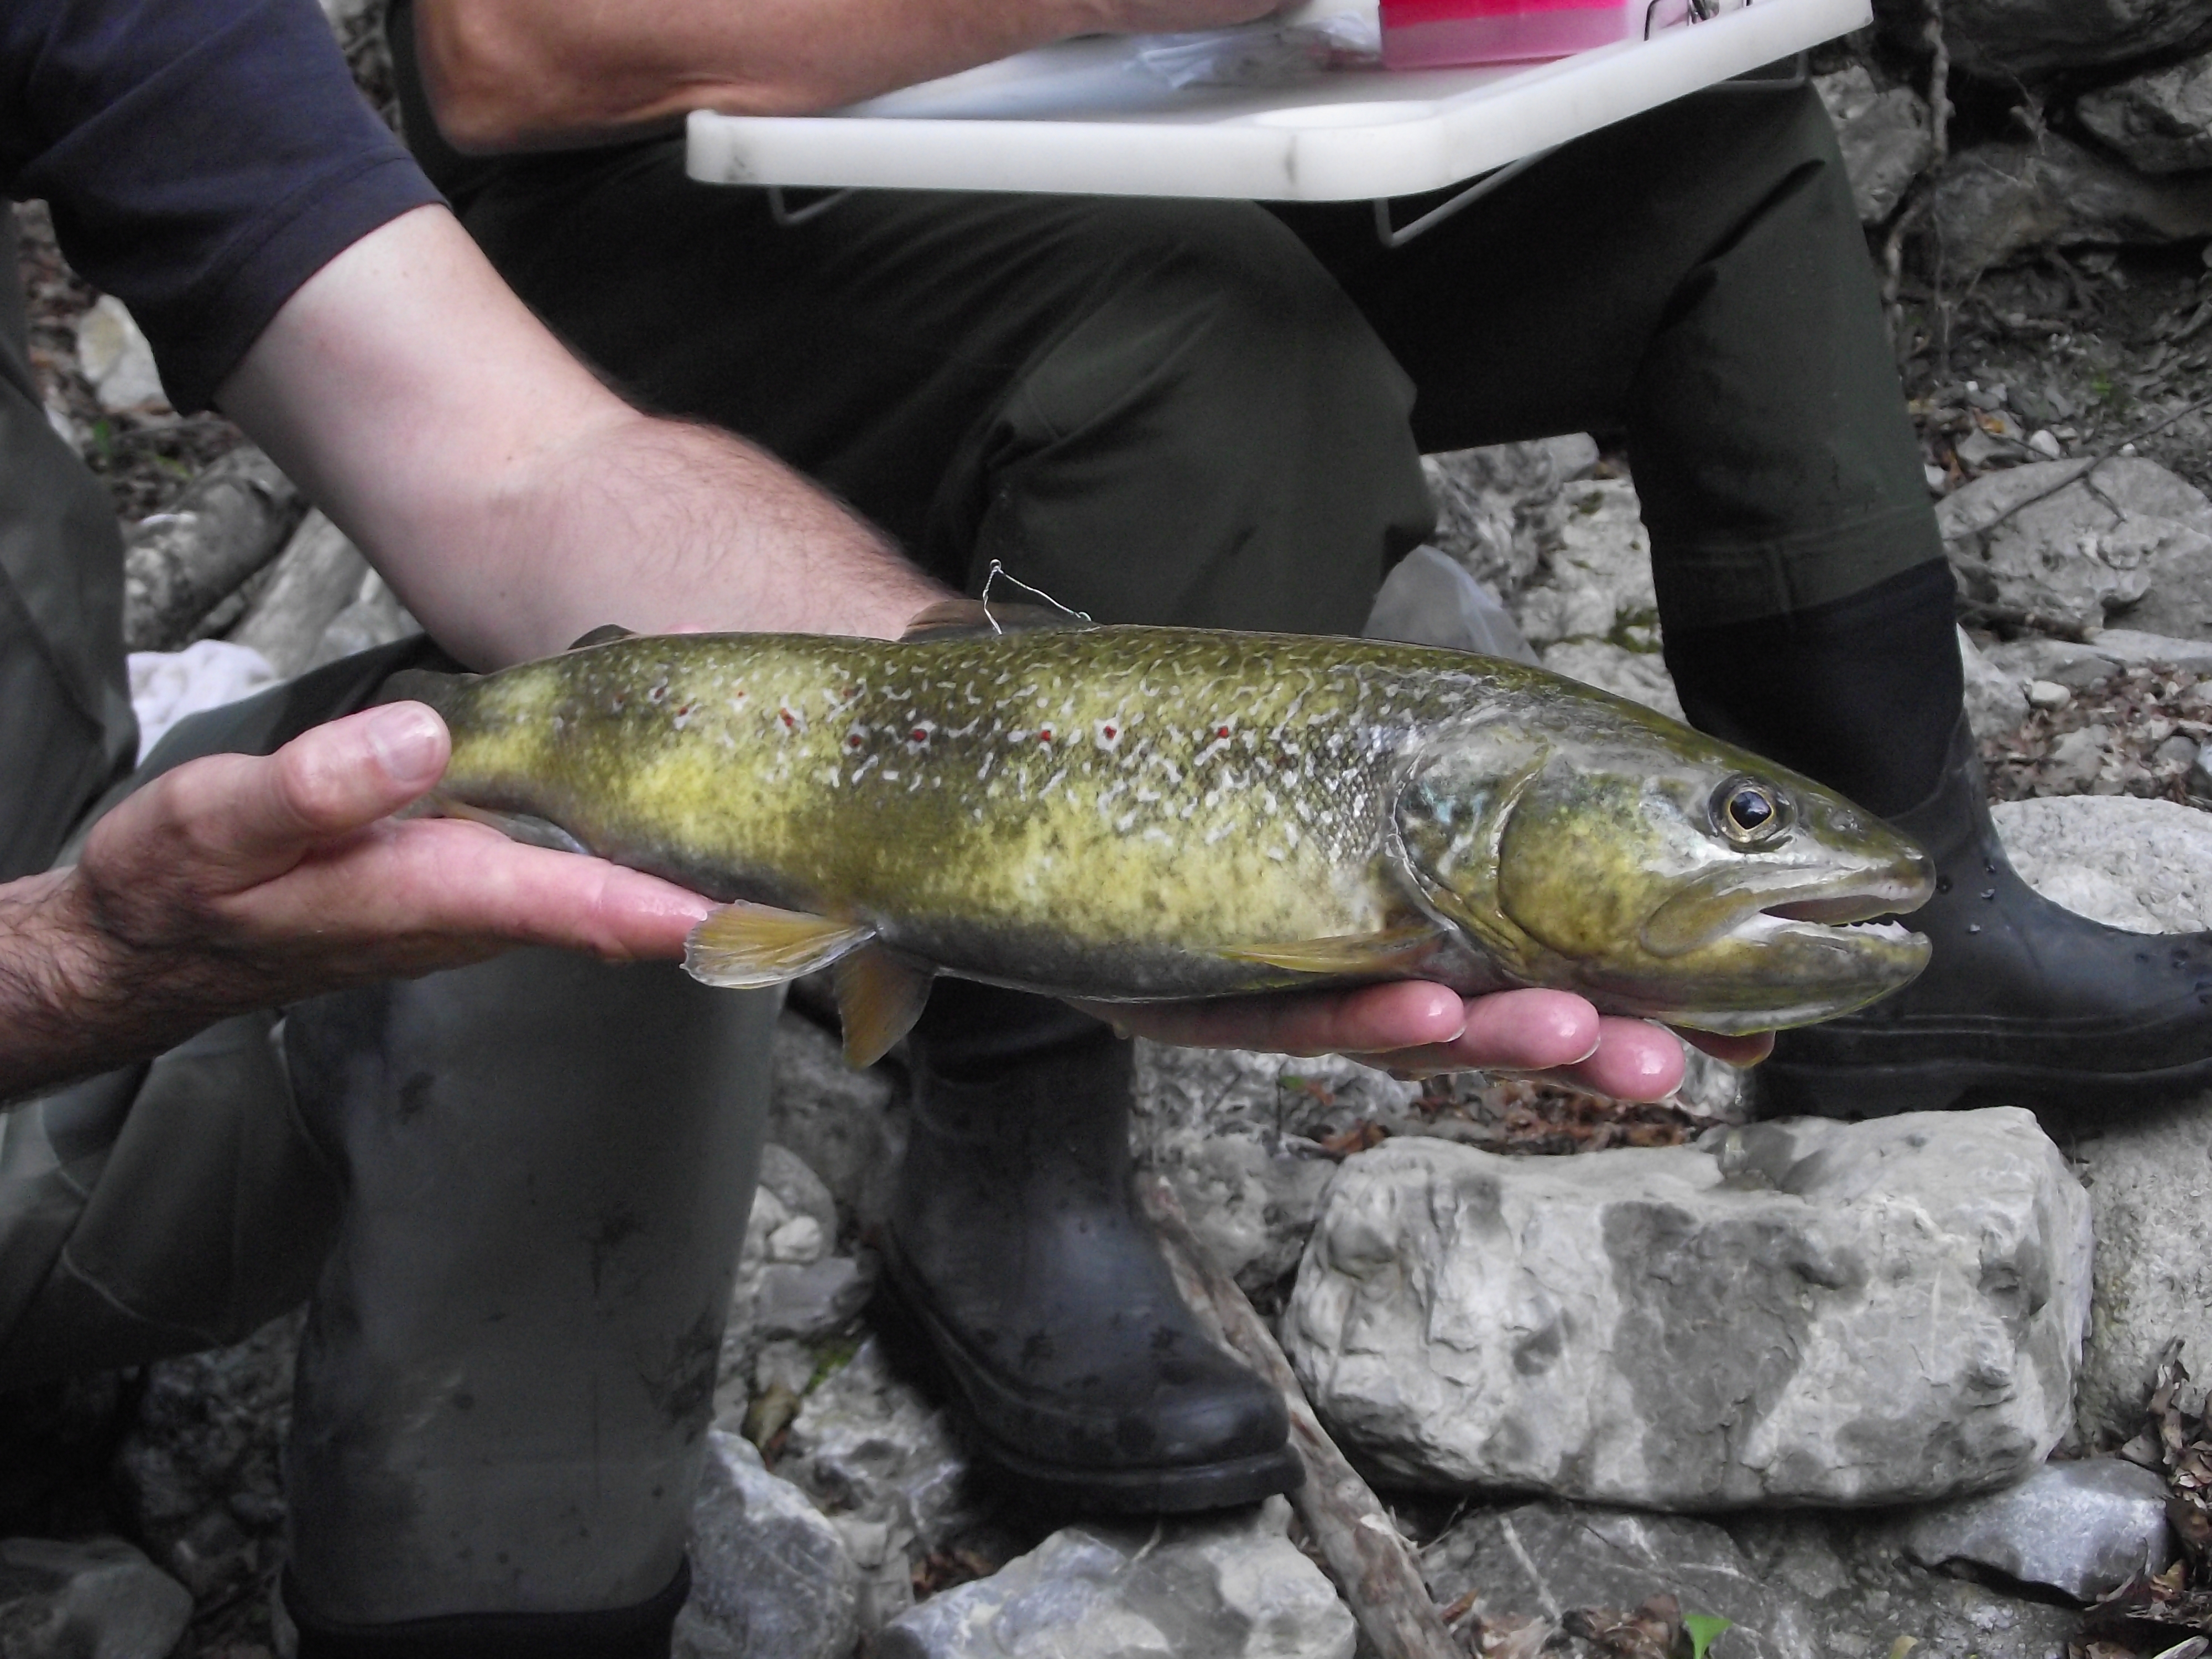
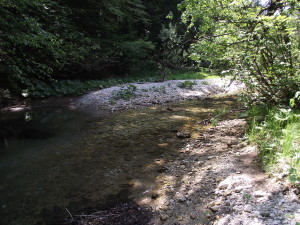
Marble trout is a freshwater resident salmonid endemic in the Adriatic basin of Slovenia. Whether there are still pure marble trout populations living in the Po river system (Northern Italy) is subject of current research. Marble trout live in streams with mean summer temperature below 15°C and winter temperature ranging from 0 to 5 °C. Marble trout spawn in November-December and offspring emerge in May-June.
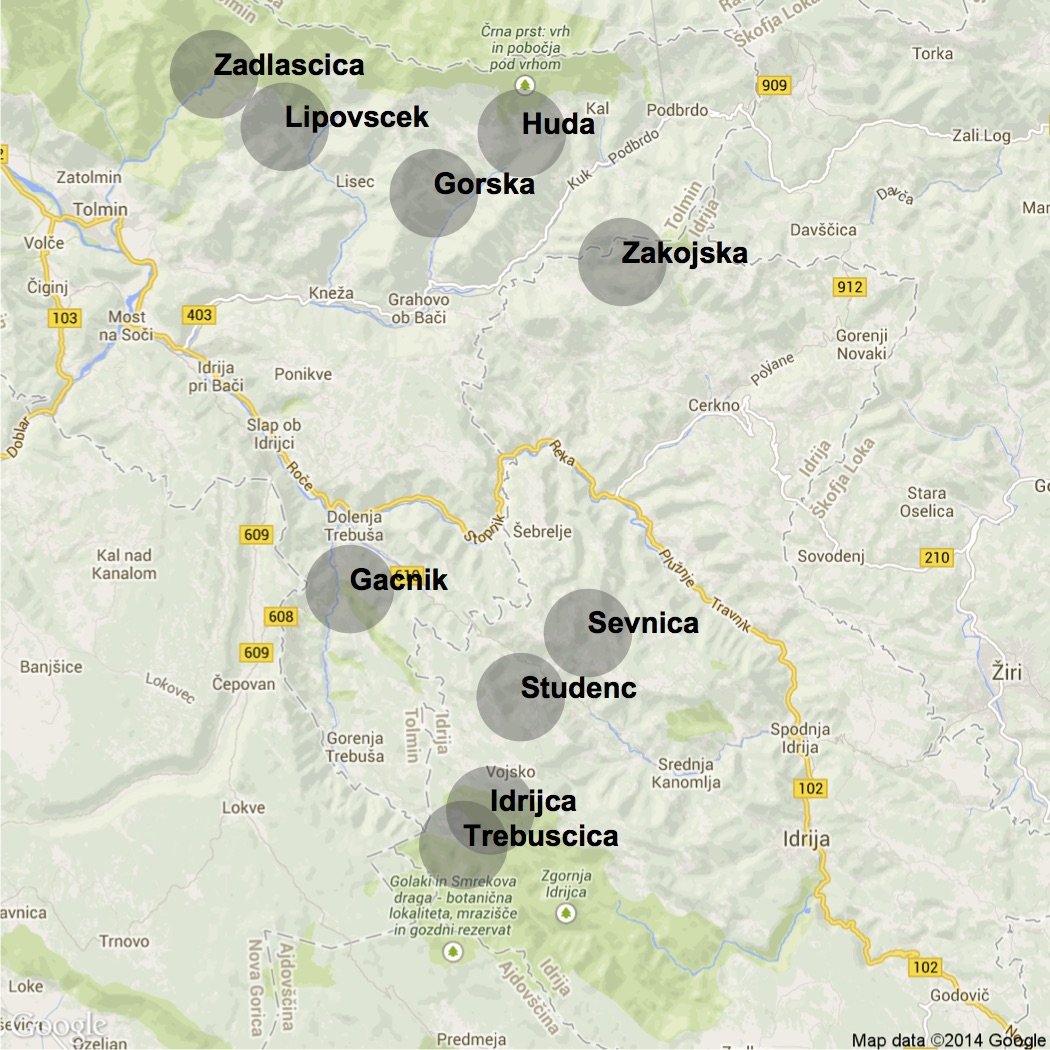
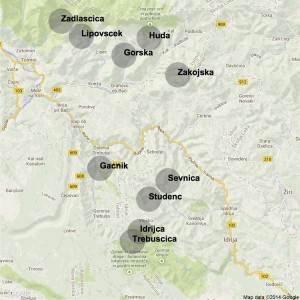
The Marble Trout Conservation Program started in 1993 in the upper reaches of the Soca River basin and its tributaries - the Idrijca and Baca Rivers - in Western Slovenia. Eight pure marble trout populations, all isolated and separated from the downstream hybrid marble-brown trout zone by impassable waterfalls, live in headwater streams in the basins of Soca, Baca, and Idrijca Rivers: Huda, Lower Idrijca, Upper Idrijca (in the map below Lower and Upper Idrijca are grouped together), Lipovesck, Studenc, Svenica, Zadlascica, Trebuscica.
Other two populations (Zakojska and Gacnik) have been created by translocating the progeny of the Zadlascica (Zakojska) and Trebuscica X Lipovesck (Gacnik) in 1996 and 1998, respectively.

2. Analyses
For some of the analyses I intended to carry out (temperature-dependent survival, growth, and recruitment), it was necessary to have complete temperature records for all streams since the start of the sampling. However, there were some missing data (sometimes whole seasons/years) in evert stream. The temperature .csv files are (stream_name)_temp.csv, the first column is the Date, the second is the mean daily temperature (Temp). Start by sourcing the file Temp.r, which is reading all the temperature files and merging them together (r scripts are here).
source("Temp.r")
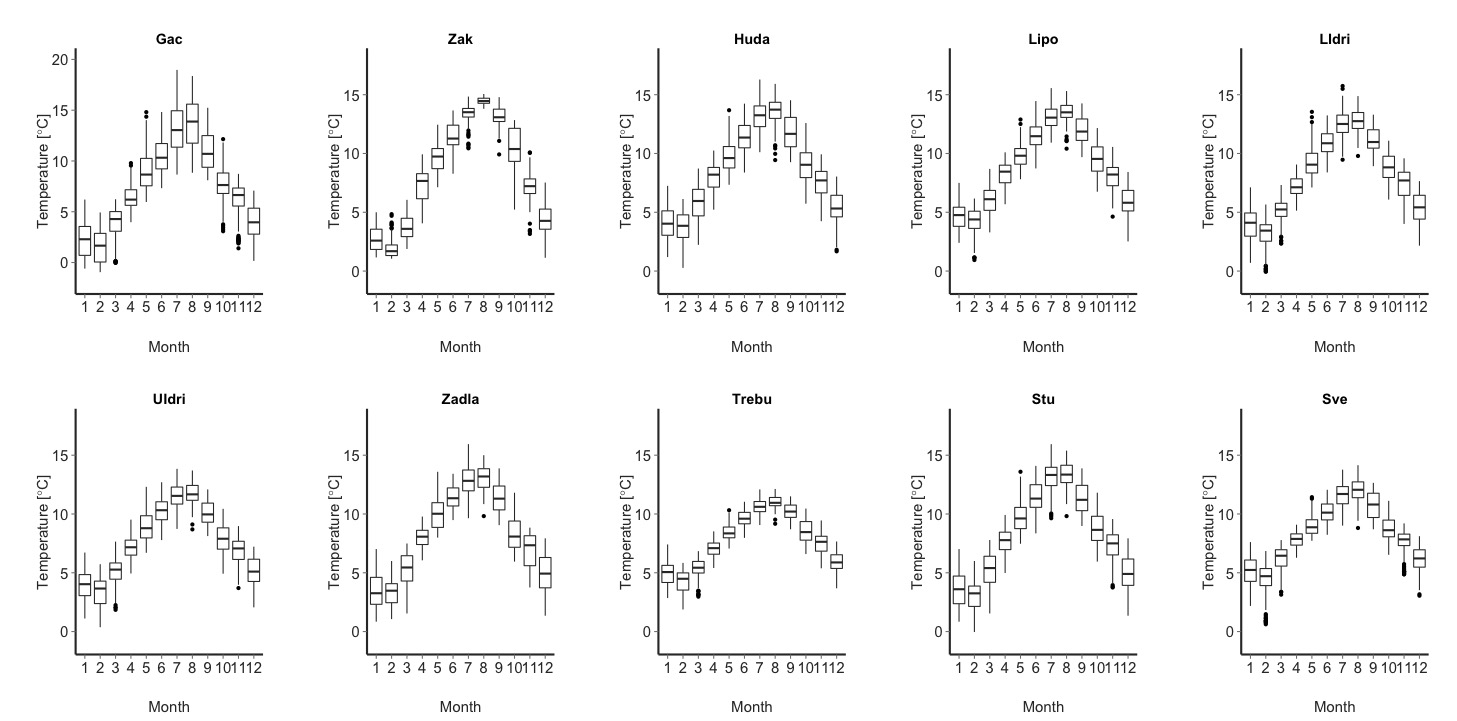
The output temp.all.df (along with the production of a ten-panel plot with stream-specific monthly temperature boxplots for 2009-2013) is a data.frame with columns Date, Temp, Year, Month, Stream, Calc (Meas = temperature has been recorded, see below for other values) (see below).
Daily Water Temperature (C)
| Date |
Temp |
Year |
Month |
Stream |
Calc |
| 1996-07-04 |
10.98 |
1996 |
7 |
Zak |
Meas |
| 1996-07-05 |
10.99 |
1996 |
7 |
Zak |
Meas |
| 1996-07-06 |
11.26 |
1996 |
7 |
Zak |
Meas |
| 1996-07-07 |
11.19 |
1996 |
7 |
Zak |
Meas |
| 1996-07-08 |
11.06 |
1996 |
7 |
Zak |
Meas |
| 1996-07-09 |
9.96 |
1996 |
7 |
Zak |
Meas |
| 1996-07-10 |
9.85 |
1996 |
7 |
Zak |
Meas |
| 1996-07-11 |
10.07 |
1996 |
7 |
Zak |
Meas |
| 1996-07-12 |
10.51 |
1996 |
7 |
Zak |
Meas |
| 1996-07-13 |
11.08 |
1996 |
7 |
Zak |
Meas |
Then, I tested the correlation between stream temperatures between pair of streams (one is the target - the one with missing data - and the other is the tested). I used the temperature data of the tested stream with the highest correlation with the temperature data of the target stream to impute the missing temperature data in the tested stream.
The Temp.corr.f function tests the correlation between water temperature data recorded in different streams.
source("Temp.corr.r") # contains Temp.corr.f
Temp.tb = Temp.corr.f(temp.all.df)
The Temp.tb data.frame has columns target stream (tar), tested stream (var), correlation between stream temperature of the two streams (cor), years with common number of days with temperature recorded (common.years), years with missing data for the target stream (miss.years), and years with missing data for the target stream, but with complete data for the tested stream (miss.in.var). The years in miss.in.var can thus be used to impute the missing data.
The correlation between water temperature of streams are typically very high (mean correlation[sd] = 0.97[0.01]).
Correlation of water temperature
| tar |
var |
cor |
years.cor |
common.years |
miss.years |
miss.in.var |
| Zak |
Gac |
0.95 |
5 |
2001-2002-2005-2009-2013 |
1996-1997-1999-2000-2006-2008-2010-2011-2014 |
2006-2008-2010-2011 |
| Zak |
Sve |
0.95 |
3 |
2002-2009-2013 |
1996-1997-1999-2000-2006-2008-2010-2011-2014 |
2006-2008-2010-2011 |
| Zak |
Stu |
0.97 |
3 |
2005-2009-2013 |
1996-1997-1999-2000-2006-2008-2010-2011-2014 |
2006-2008-2010-2011 |
| Zak |
LIdri |
0.97 |
3 |
2005-2009-2013 |
1996-1997-1999-2000-2006-2008-2010-2011-2014 |
2006-2008-2010-2011 |
| Zak |
UIdri |
0.96 |
3 |
2003-2005-2013 |
1996-1997-1999-2000-2006-2008-2010-2011-2014 |
2006-2010-2011 |
In each stream, I imputed the missing data (1) using the temperature data from the tested stream with the highest correlation with the target stream and (2) by applying the best model (linear or non-linear - gam -, chosen according to best prediction) linking the water temperature data of the two streams. The r script for imputing missing data is in Temp.filling.r.
source("Temp.filling.r")
The output of the script is the data frame temp.all.df with columns: Date, Temp, Year, Month, Stream,
Calc (Meas = temperature recorded in the stream, Gac2005 = in one year (1997) we had missing data for Gac and the only acceptable data for imputing was coming from Gac in 2005, Same_as_a = Same temperature as days after (just for a few days missing), Same_as_b = Same temperature as days before (just for a few days missing), Zak2012 = in one year (1997) we had missing data for Zak and the only acceptable data for imputing was coming from Zak in 2012, Stream_name = stream whose temperature data was used to impute missing data, degree_days = degree days for the day using 5C as base temperature, Sampling_Season = Summer for June, July, September - Winter for the rest of the year). Sampling occurred either in June or September or in both.
Daily Water Temperature (C)
| Date |
Temp |
Year |
Month |
Stream |
Calc |
degree_days |
Sampling_Season |
| 2006-08-19 |
13 |
2006 |
8 |
Stu |
Meas |
7.8 |
Summer |
| 2006-08-20 |
13 |
2006 |
8 |
Stu |
Meas |
7.8 |
Summer |
| 2006-08-21 |
13 |
2006 |
8 |
Stu |
Meas |
8.1 |
Summer |
| 2006-08-22 |
13 |
2006 |
8 |
Stu |
Meas |
7.6 |
Summer |
| 2006-08-23 |
13 |
2006 |
8 |
Stu |
Meas |
7.6 |
Summer |
| 2006-08-24 |
12 |
2006 |
8 |
Stu |
Meas |
7.3 |
Summer |
Temperature data is now ready to be used to test differences in water temperature between streams, and temperature-dependent survival, growth, and recruitment.