Author Archives: admin

Academic life - Part 3

During my Ph.D., I also did quite a bit of consulting for the private industry, started teaching, and gave a number of seminars on climate change to high school students.

In Italian universities, it was common (and I believe still is) to get funding for Ph.D. scholarships, traveling, and buying tools and materials such as computers and lab instruments by doing consulting work for regional or state agencies, or for the private industry. In 2005, my Ph.D. supervisor asked me if I was willing to work on a consulting contract with a local company, which consisted in estimating the impact of activities related to cement production on atmospheric pollution. I had taken a class on atmospheric modeling during my Master's (the teacher was a researcher for the National Research Council and had a teaching style that I am going to describe using a euphemism: terrible) and that was the extent of my knowledge, which is equivalent to say I knew little about the topic. However, environmental modeling is not particularly complicated, especially when there are good software and good data, and you are a university researcher (yes, it counts). I accepted to lead the consulting work, which went on for more or less five years with some pauses here and there; it brought in very good money, which was later used to pay for my postdocs. It was time-consuming, but overall a good experience and money helped quite a bit.

In 2006, my Ph.D. supervisor asked me (he was taking parental leave for the year) to be the Instructor of record for the 2006-2007 course on "Population Dynamics and Management of Renewable Resources” for the Master's degree in Environmental Sciences. Since I rarely said no to more work or new challenges and I have never been short of self-confidence, I accepted. I was still quite young (26-27 years old) and a couple of enrolled students had been students with me some years before. It was my first experience in teaching a full course, and I did reasonably well. I would do much better now, but using today as a reference point for ten years ago is silly.

A couple of episodes. One time, I asked one of my Ph.D. colleagues to write a question for an intermediate exam, but during the exam, I recognized that there was something wrong about that problem, maybe incomplete information or the problem was ill-posed. I told students to skip that part of the exam, but some of them started complaining and protesting because now they had wasted time on that problem and it was not fair and other similar observations. I decided to use my institutional power and said: "I am the teacher and you do what I say. You have 15 minutes more". It was the correct approach, they need to know and feel I was in charge, personal power was not enough. They immediately calmed down and there were no more protests. Another time, I organized a visit to a regional park close to Parma; I made all the arrangements for transportation by bus and for lunch at the park restaurant on a lovely spring day. It was a very pleasant and informative trip, and the students told me they had a great time. The park director did not seem to believe I was the teacher, though, too young. Good times.

I was also still playing soccer at quite a high level (I was getting much more money playing soccer than by teaching and being a Ph.D. student combined). I was training 4 or 5 times a week, either in the morning or early in the afternoon, and I was going back and forth between my desk at the university and the team facilities, which were 30 km away from the university. On Sunday I was busy all day with championship matches, and when the away match was played more than 3 hours away from my town, we were leaving on Saturday and sleep in hotels. On Monday, I was dead, physically and emotionally. I was teaching, doing research, doing consulting, playing soccer, I had a girlfriend and a social life, but only a few times I felt overwhelmed (playing soccer was by far the most stressful part of my life, if you have ever played a team sport at a high level, I am sure you can relate. If not, it is difficult to describe the feeling of guilt when you make a mistake and you feel like you let your teammates down. It rarely happened to me, but if you play long enough, it happens)*. Now, I am pretty confident I would feel overwhelmed, but mostly because I would think about the situation being overwhelming. At the time, I was not thinking much, mostly doing. Better times?

Unfortunately, I started having painful physical problems; in the summer of 2006, the Achilles tendon of my right leg started to get inflamed and the situation rapidly got worse. I had problems even when walking, but I was biting the belt, as we say in Italian**. I had cortisone injections whose beneficial effects lasted for ten days, but after those effects were over, the pain was excruciating. Sometimes, it felt like I had a lighter turned on on my Achilles. I tried all kinds of conservative treatments, but in 2008 I decided to have surgery. It was an excellent decision, since I never had any problems after the surgery.

That's me showing some vertical. A few months after this photo was taken, I could barely walk. Much of my waking hours were drenched in pain and frustration. I had to warm up my Achilles for a couple of minutes before standing up

Looking back at the seminars I gave on climate change, I can only laugh. I was not prepared enough, one time there were more than 200 students listening to my talk, but somewhat I managed to answer to students' questions and gave them an idea about the effects of climate change. I believe the most important thing was to show them that I was enthusiastic about presenting the material and that I was concerned about climate change. The effects of presenting yourself as a good role model last much more than any information you can provide in one hour.

Footnotes

* I don't believe sport builds character or show character. I do believe that hugging your teammates after a victory, sharing the disappointment after a defeat, stomping the cleats on the locker room pavement before going on the pitch, are among the strongest, most fulfilling memories of my life.

** In the summer of 2007, while in Pacific Grove, CA, I was so desperate that when a physiotherapist asked me 250 dollars for a first 30-minute consultation (not even treatment), I answered: go ahead. Didn't solve the problem.

Academic life - Part 2


In the summer of 2005, I visited for two months Hamish McCallum and Hugh Possingham's labs at the University of Queensland in Brisbane, Australia. Hamish had done some work with my PhD advisor on diseases and I thought visiting his lab was an excellent opportunity for broadening my scientific horizons. I was also looking forward to going back to Australia after a very fun vacation in the summer of 2003 following the end of my Master's.

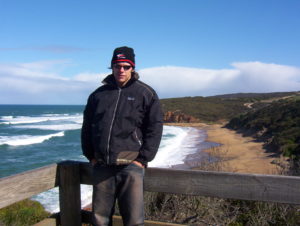
In Australia in 2003. I need to go back

Hamish and his wife were terrific hosts (I didn't have any interaction with them after my 2005 visit, something I regret) and I remember a nice, although brief, conversation with Hugh Possingham (Full Professor at the University of Queensland, who I had met the year before at a workshop in Trieste) about my PhD research (I met Hugh multiple times in later years, always brilliant and very gracious). Hugh is one of the most talented and relevant conservation biologists in the world (now also Chief Scientist of the Nature Conservancy) and he offered some suggestions on more conservation-motivated studies on marble trout. I still think about those suggestions, which have been a recurrent theme in my research statements since then*.

I also visited my friend Donna from Melbourne who I had met for the first time in 2003 (one of the kindest people I have ever met in my life. I have been trying forever to get back in touch with her, but her email address apparently changed and she has no presence on social media) and my former soccer teammate Gianfranco Circati, who had moved to Perth with his family the year before. Overall, I had an amazing time in Australia, personally and professionally**.

With my friend Donna, nowhere to be found, but not forgotten

My research on spatial distribution models of species was steadily going forward. The first paper I published on species distribution models for clams is still my most-cited work (~80 citations as of March 2017. Vincenzi, S. et al. 2006 A GIS-based habitat suitability model for commercial yield estimation of Tapes philippinarum in a Mediterranean coastal lagoon (Sacca di Goro, Italy). Ecol. Modell. 193, 90–104). I refined an idea of my PhD advisor about combining data and expert knowledge to get a better understanding of the spatial distribution of clams and of the commercial yield potential of different areas within coastal lagoon. Clams can grow well in certain areas, but due to constraints such as water depth or accessibility by boat, the commercial yield potential of that area could be close to zero. In applied work, I firmly believe that expert knowledge has to be seriously taken into account, as it often can provide better or faster insights (they are already there, just ask them!) that those provided by more formal methods of investigation. Fishermen are there to make money and they do not waste time harvesting or fishing where there are no clams or fish (or mushrooms, if we extend the analogy to mountain people, but don't ask them because they are not going to tell you where the mushrooms are) or where clams or fish cannot be harvested or fished.

I presented the results of my work on clams at the 2004 annual meeting of the Italian Society of Ecology (basically 4 months after the start of my PhD) and I won the award for the best talk given by a young researcher in ecology (along with 600 euros if I remember well, handed over by the at-the-time Italian Minister of Environment Altero Matteoli). Fiorenza Micheli, now Full Professor at Stanford, was in the award committee; supported by my PhD advisor, I asked her to visit her lab in the summer of 2006. It was my first trip to the US and one of the turning points of my academic career.

Let's get back to fish. Due to the strong relationship between egg production and body size of females in salmonids, I also became interested in finding out the determinants of variation in fish body size and estimating their relative importance. I still didn't have a clear vision for my research, which was truly driven by the curiosity of the month or of the week. However, one of my long-standing interests was understanding variation in phenotypes in humans and their environmental determinants, and I was reading with a certain interest about predictive adaptive responses and the famous Dutch famine study.

Predictive adaptive responses are physiological or behavioral changes in an organism that become fixed after early stimuli. For example, it is now well known that growing up in an unstable family (drugs, alcohol, violence) increases the chances of having pregnancies (too) early in life and of being sexually more adventurous. The hypothesis is that the most parsimonious prediction on the quality of the adult environment is that it will be similar to the environment experienced early in life; since life is predicted to be short and brutish when growing up in an unstable environment, it is adaptive (that is, it increases fitness) to try to reproduce as fast as possible (see Nettle, D. et al. 2010 Early-life conditions and age at first pregnancy in British women. Proc. Biol. Sci. 278, 1721–1727). Simply, if you wait too long, you might not be there anymore, so better trying to have fun earlier than never.

My research on predictive adaptive responses had also some profound implications for my view of the world. Much of our behavior is outside our conscious control and very often the results of our genetic make-up and of things that happened when we were babies (or even before when surrounded by the placenta), but easily "rationalized" a posteriori. Years later during a science retreat, I told one of my colleagues that I was surprised that so many scientists rarely apply their scientific skills, thinking, and findings to everyday problems. He did not get my observation, which kinda proved the point. On the other and darker side of the moon, I read a blog post written by a scientist a few years ago in which she was trying to motivate herself to exercise by reviewing papers that found a positive relationship between physical exercise and health, mental sharpness etc. I was both amused and appalled, but mostly appalled. It's like reviewing papers describing how water extinguishes bonfires.

Back to fish again. I saw an opportunity to test some general hypotheses on the determination early in life (we can also call it "imprinting") of adult phenotypes using trout as a model system. In this context, the main differences between humans and fish are that fish continue to grow after sexual maturity, albeit at a much slower place, and the far bigger role of environment (food, temperature) relative to genetics in determining body size in fish with respect to humans. Marble trout (mostly marble-brown hybrid) can reach 20 kg when living in lakes or reservoirs and close to 1 kg when living at higher altitudes***.

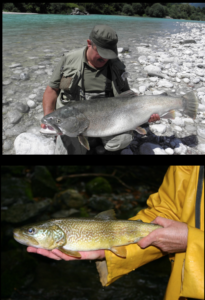
Big fish in the reservoir and big fish in the upstream reaches, quite a striking difference

As can be easily inferred by the steady increase of mean height in humans living in Western societies after WWII, environment (better food, medicine and more hygienic conditions limiting the effects of diseases, thus allowing the allocation of more energy to growth) plays a role in human growth, but current mean height of Italians is no more than 10% greater than their pre-WWII mean height. It felt like I was connecting my research on marble trout with something I had a deep interest for. Predictive adaptive responses and early determination of early phenotypes became a theme underlying - implicitly or explicitly - much of my research****. I found out that the mean body size at age 1 of trout born in the same year (a year-class) well predicted their mean size at later ages, and that mean body size of a year-class was well predicted by how many other individuals were living in the population when the year-class was born. Then, fish relatively smaller early in life were also relatively smaller later in life, there was little chance to catch-up. I published the results in two papers and years later I used much more sophisticated statistical methods to further refine my insights.

I also became interested in the role of extreme events in determining the risk of extinction of these small (typically a few hundred fish) and isolated (fish cannot move from one stream to another) marble trout populations. Alain Crivelli (a fantastic field biologist who started the marble trout project and recently retired, we had a great, stimulating, and productive collaboration over the years) and Dusan Jesensek (manager of the Tolmin Angling Association, solid leader of men, very bright, dedicated, and with great skills for field work) were also interested in the effects of flash floods. In 2004, flash floods and debris flows led to the extinction of one population of marble trout (living in a stream called Gorska) and a noticeable reduction in population density in some other populations. What if the main determinant of risk of extinction was the frequency and intensity of flash floods or debris flows, and survival, growth, and reproduction played a much smaller role?

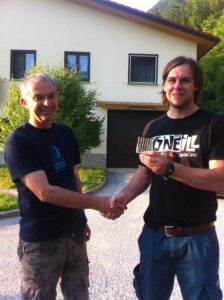
Dusan and I in 2013 with some WWI bullets. I have been wanting for a long time to write a book on marble trout and WWI. No connection between marble trout and WWI, apart from geography (Western Slovenia was the theater of many battles fought by Italian and Austro-Hungarian armies). The inspiration, at least for the title, comes from one of my favorite books: "The Great War and Modern Memory" by Paul Fussell

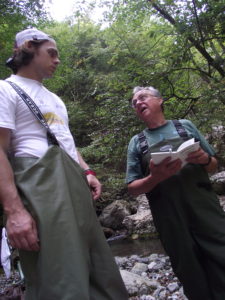
Alain and I in 2012. I always find inspiration for my modeling work when spending time in the field. I tried to go to Slovenia at least once a year

The main problems were that, first, we did not have any information on water flows in the mountain streams that we were monitoring and, second, the gauges installed in the main rivers (Soca, Idrijca, Baca) could not be used to infer water flows in their tributaries, those small mountain streams in which marble trout live. Weather in Western Slovenia is highly local, and the effects of bad weather on areas only 10 km apart can be (and often are) vastly different. Although there was a bit of circular reasoning, we knew that an extreme event occurred when we observed massive mortality of fish along with visible modifications of the habitat, such as huge boulders that had moved downstream, mud everywhere, or downed trees.

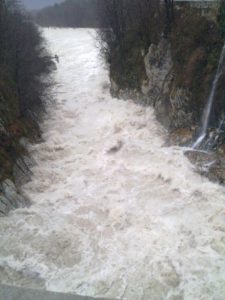
This is a flash flood in Slovenia. Water rises and goes down in just a few hours

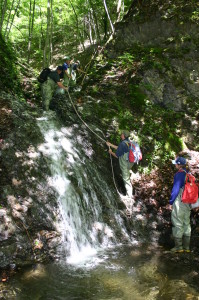
Extreme water flows and landslides move boulders and down trees. Still a magical landscape

I proceeded with a scenario analysis (what if the time of return of flash floods is 10 years? 20 years?) and I wrote a very nice paper with my colleagues that was later published in Biological Conservation (Vincenzi, S. et al. 2008 Potential factors controlling the population viability of newly introduced endangered marble trout populations. Biol. Conserv. 141, 198–210). Apart from hybridization with brown trout and flash floods or landslides, marble trout were doing well. And why should we have expected anything different? Generally, changes of state are rare (while playing soccer I was often saying that I could easily predict the injured of tomorrow by looking at the injured of yesterday), and marble trout had been living in those streams for centuries and maybe thousands of years. At that point, I expected population viability analysis for marble trout to be largely a waste of precious research time, and I started to get more and more interested in the evolution of traits following flash floods and in investigating which mechanisms were allowing fish to bounce back to normal abundance levels after they got heavily reduced in numbers by flash floods. While one population got extinct, others were recovering fast after getting hit by a flash flood.

Gorska, 2005. No fish found after the flash flood of 2004. I am at the bottom

Footnotes

* In 2004, flash floods and debris flows led to the extinction of one population of marble trout (Gorska) and a noticeable reduction in population density in other populations. Hugh suggested trying to estimate the correlated risk of extinction of multiple populations following weather extremes. In 2013, I collected a huge amount of data on daily rainfall all over Slovenia (>200 stations, records start typically in the 60s) with the goal of estimating a spatial correlation structure of rainfall extremes. Data are still there, but I never had the time to properly analyze them. It would be an amazing project for a PhD student in ecological statistics or applied math. Send me an email if you are interested.

**I still have this memory of me coding in R at the bar of the hostel in Brisbane where I was staying. Before moving to the hostel, I was staying at a cottage quite far from UQ, going there by bike was like doing the Paris-Roubaix every morning. Anyway, the R code was for a bootstrapping procedure I used for estimating survival of marble trout in the first year of life (Vincenzi, S. et al. 2007 Early survival of marble trout Salmo marmoratus: Evidence for density dependence? Ecol. Freshw. Fish 16, 116–123.). I knew very little about bootstrapping, MonteCarlo procedures and similar simulation-based methods, but it always felt intuitive to me using simulation-based approaches (also because I do not like very much to use pen and paper to find analytical solutions) for statistical inference and scenario analysis.

*** I regret not having invested more time understanding how much variation in growth in marble trout is due to variation in food. Offspring of wild trout growing in fish farm fed ad lib grow a bit faster and bigger than trout growing in the wild, but fish growing in reservoirs can become huge (up to 20 kg). Those fish living in reservoirs are marble-brown hybrid, but hybrid vigor alone cannot explain the huge variation in size. My, Dusan Jesensek, and Alain Crivelli's hypothesis to explain the variation in size between fish living in the reservoirs and fish living in mountain streams was piscivory. Although marble trout living in the wild can be cannibals (and many of them are), in reservoirs they have access to more fish and a larger variety of species (only marble trout are living in those mountain streams). They start eating fish, they become bigger, they can eat bigger fish because their mouth gets bigger and so on. However, it is difficult to understand why cannibalism cannot provide a similar positive feedback (large marble trout as far we know do not eat other marble trout that are age 4 or older) or why cannibalism does not lead the population to extinction. If they can eat one little marble, why don't they eat ten? I also found fascinating that goldfish living in small bowls become smaller than goldfish living in bigger bowls. Can "sensing the environment" explainin part why marble trout do not grow as big as they genetic potential would allow? As far as I know, there is no literature on this topic. We talked about doing isotopic analysis on trout living in the reservoirs in 2013, but there was not enough money or not enough interest. Oh well.

**** As I wrote in the Discussion of my 2014 PLoSCompBio paper: "A sizable literature on prediction of future growth exists for humans, especially in the context of early identification of pathologies [...]. An approach similar to that presented in our work for the estimation of lifetime growth trajectories given only information on growth and size during the early stages of life was proposed in [...] and [...]. In particular, in [...] Shohoji et al estimated the lifetime growth of Japanese girls using measurement up to the age of 6 years old. They first adapted to humans a parametric model previously developed to model the growth in weight of savannah baboons.". The connection of human growth was still there (I also used birds later on to investigate similar processes).

Academic life - Part 1

“Three things were more important to him: the regular improvement of his game; his rich and resuscitative returns to states of mystic calm whenever his psychic vigor flagged; and, during his seventeenth year, his first love.”

From: Trevanian: “Shibumi” (one of my top three favorite books).

I got my Master's degree in Environmental Sciences at the University of Parma (Italy, my beloved hometown) in July 2003; at the time, in Italy Bachelor's and Master's were combined in a single 5-year program. Later, following the Bologna process, the "3 + 2" (Bachelor's + Master's) became the standard also in Italian universities. For my Master's thesis, I developed a model in Visual Basic for Applications to estimate the amount of pollutants emitted by on-road transportation. The model was never used by the local city agency of environmental control that supported my thesis, but I believe it was a decent piece of software.

Following my Master's and a tremendously boring 2-month job as an environmental consultant for a local company*, Prof. De Leo (formerly my teacher in the Ecological Modeling course and then my PhD advisor, who just got back to academia full time after a one-year stint doing research for a regional institution) encouraged me to apply for the PhD program in Theoretical Ecology at the University of Parma.

The selection process included a written exam, basically a discussion of one paper selected by the committee among some one hundred foundational papers in ecology and evolutionary biology, and an oral exam. I had been an exceptional student (I won the Dean award for best student in my cohort for at least 4 out of 5 years if I remember well, maybe all five), but at the time I had zero experience in academic research, I had never been part of a lab, and maybe I had read a couple of peer-reviewed papers. Unlike many future research colleagues, I also had no long-standing, deep interest for the natural world, I did not come from an academic or professional family, and I have no recollection of ever having had the overpowering urge to find out something about the natural world. I mostly liked reading, writing, studying, doing sports, and getting the highest grades in every class. Work options were simply not so interesting and continuing to study was definitely more attractive. I was also playing semi-pro soccer and income was fine. I am confident I could have played professionally, but I was not really interested, as I very much appreciated the life of the mind.

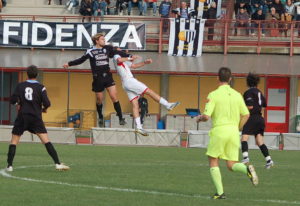
Playing soccer in 2006

Two PhD scholarships for Ecology were offered at the Department of Environmental Sciences in 2004 and following one of the most rigged selection procedures of all time, I arrived third. There was a "beef" I was not aware of within the Department, scholarships were to be assigned to other faculties and their students, but I was too naive at the time to understand what was going on. Luckily, one of the two winners (now a local politician) gave up on his scholarship and in April 2004 I was able to start my (miserably paid, 800 euros a month) research. However, I did not have any potential research in mind for my 2.5-year PhD (they should have been 3 years, but they became 2.5 because due to funding problems the program started only in late April-early May 2004).

My PhD advisor (who has been very supportive throughout my whole academic career and still is a very good friend) suggested a couple of options for my PhD thesis, one about estimating the yield potential of clams in lagoons using species distribution models (a very profitable, largely unregulated industry in north-eastern Italy) and the other about analyzing data on trout populations living in Slovenian streams. Dr. Alain Crivelli, a biologist at Tour du Valat (France) who had been working with my PhD supervisor on the population dynamics of eels, a few years before had started collecting data on endangered populations of marble trout living in Slovenia (you can find details on the Marble Trout Project in my papers). He told my PhD advisor that he was interested in a PhD student doing some Population Viability Analyses to better understand the risk of extinction of those marble trout populations. PVAs were quite en vogue in the 90s and early 2000s, but are largely outdated now as far as I know.

Since I had no strong interest in a particular area of ecological research (i.e., I knew nothing), but I always felt accomplished when solving problems, I am mildly workaholic, and I do not like to say no, I decided to work on both topics. Marble trout soon appeared to be a much more interesting model system, and the papers on species distribution models were not included in my PhD thesis.

Marble trout eating another marble trout. They are very tasty

Since there were just 3 PhD students in my cohort, formal classes were neither required nor offered. Looking back, some classes (statistics, mathematical modeling, writing papers and analyzing literature, field- and theoretical ecology) would have been extremely beneficial for my scientific development and would have encouraged bonding among students and faculties. Soon, I started traveling taking advantage of a 50% increase in salary when abroad (field work in Slovenia, two-month visit to the University of Queensland in Brisbane in 2005, two-month visit to the Hopkins Marine Station in Pacific Grove, CA), and my research was largely self-directed.

Although I won't go into personal details, the start of my PhD coincided with the end of a relationship (it was clear that the relationship was over when I spent way too much time betting on the 2004 Olympics. However, I won money with Paolo Bettini in cycling and Karam Gaber in wrestling. I did not know about Gaber, but while in Sharm El Sheikh I watched one of his workouts on the local tv and I immediately understood he could not lose. Easy money, one of the most dominant and spectacular wins in the history of Olympic wrestling).

I tried to use standard software for PVAs, but they were clearly not meant to be used for fish. After attending a class on R in 2004 or 2005, I started using R and Matlab (I do not remember why and how I started to use Matlab, but I quickly became reasonably proficient) to estimate vital rates, developing models of population dynamics for marble trout, and developing spatial distribution models for clams. I worked long hours and spent a big fraction of my waking hours at the office (a very small space shared by 4 people, looking back it was a terrible set-up and it was surprising I was able to work),  but I never felt particularly stressed, overall work was enjoyable, I was publishing papers (5 at the end of my 2.5 years), and very proudly hanging their first page on the wall next to my desk. Quite surprisingly, I found pretty easy to publish papers at the time, despite knowing very little (it is relatively much more difficult to publish now despite me knowing much more - my knowledge climbed from 1 to 3, but on a log-10 scale - although my target journals are now way more prestigious).

However, I had very little idea of the "big questions" behind my research, little or no knowledge of the trajectory of the field (and which field? Basic ecology? Population dynamics? Animal conservation? Species distribution? Ecological statistics?), I was barely thinking about my future in academia, and I was living in almost complete scientific isolation, in part due to location as my desk space was not in the main building of the Department of Environmental Sciences. I just liked finding solutions to immediate problems (how can I estimate this vital rate?) and, being by nature very competitive, I loved publishing papers with my name in front. All mistakes for which, I later recognized, I paid a hefty price**.

* I was advising a ham-producing company for their ISO9000 and HACCP certifications. They had blood-dripping sausages in one of the refrigerators and when I looked at them, the owner's son said: "These are not here". Noped out real quick. Pay was meager, too.

** As Andrew Grove wrote in "Only the paranoid survive":  The sad news is, nobody owes you a career. Your career is literally your business. You own it as a sole proprietor. You have one employee: yourself. You are in competition with millions of similar businesses: millions of other employees all over the world. You need to accept ownership of your career, your skills and the timing of your moves. -- Then,  being less scientifically isolated would have allowed me to better understand the big questions in ecology and evolutionary biology...maybe. As I will discuss later, I was not thinking about moving abroad (I enjoyed living in my hometown, I was earning good money playing soccer, I had friends and pets and family) and to get an academic position in Italy two conditions were (and shamefully still are) necessary, the first way more important than the second: 1) being sponsored by a powerful faculty, usually your PhD advisor, and 2) publishing some papers somewhere. I simply did not see any incentives to have a big, international research vision. When I started my PhD,  word on the grapevine said that there would have been a large number of faculties retiring in 2013; after that, it would have been necessary to have a big wave of recruitment of new assistant professors to fill the empty spots. They simply downsized the personnel. Never plan further than one year in the future.


Are these interesting results? If yes, worthy of publication?

Memento mori

and remember that all monitoring programs end at some point

---

I don't remember exactly when I had the idea I describe in the following, but I clearly remember I had a conversation about it with Ryan Chisholm (now at the National University of Singapore) while attending the SIAM meeting in San Diego in the summer of 2013. Marc Mangel was invited, but he could not go. The organizer of the special session on spatial ecology asked Marc if he had a postdoc to recommend as a substitute for him and he recommended me. Semi-surreal experience with only the five people scheduled to give talks present in the room and a couple of them were busy checking emails. I had a very good time, though.

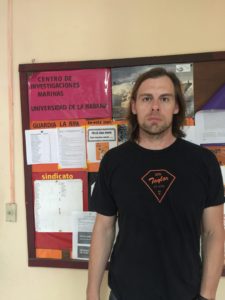
As a side note, I recently had a look at the slides of the talk I gave at SIAM 2013, and there are at least a couple of ideas that could become papers, one on density dependent growth at different spatial scales (which I had partially developed Vincenzi, S. et al. 2010 Detection of density-dependent growth at two spatial scales in marble trout (Salmo marmoratus) populations. Ecol. Freshw. Fish 19, 338–347) and one on rapid genetic differentiation in fish populations living in fragmented habitats. Ryan also talked about his recent (at the time) trip to Cuba and he convinced me - it was not too hard - to visit the island. I went to Cuba for the first time in November 2013, I fell in love with La Habana, and I have been there other 2 times, the last one (October-November 2016) also presenting my research at the Centro de Investigaciones Marinas of Universidad de La Habana.

In La Habana at the beginning of November 2016, humidity at 150% and not too happy about it.

The main idea is this: most monitoring programs start with no end in sight (funding is largely determining the duration of the program) and often with different goals that require vastly different amount of data, for instance estimating average survival or growth rates may require 3 to 5 years of data for salmonids (my model system), while estimating the effects on population dynamics or life-history traits of extreme events such as floods, fires, drought, hurricanes, tautologically require at least the occurrence of one extreme event across multiple populations or multiple rare events in one population (otherwise it is not possible to test hypotheses sensu Platt, J. R. 1964 Strong inferences. Science 146, 347–353.)

How can we define an event as extreme? As I wrote in a 2014 paper (Vincenzi, S. 2014 Extinction risk and eco-evolutionary dynamics in a variable environment with increasing frequency of extreme events. J. R. Soc. Interface 11, 20140441), "[...] extreme events may be defined in terms of extreme values of a continuous variable on the basis of the available climate record (e.g. temperature, precipitation levels) or in the form of a discrete (point) perturbation, such as a hurricane or a heavy storm. This latter category also includes environmental extremes such as unusually big fires, aseasonal floods or rain-on-snow events.". Extremeness includes and goes beyond rarity, and we can assume extreme events to be defined as extreme have recurrence intervals that are longer than the generation time of the species we are investigating.

It follows that if we are interested in the effects of rare events, the minimum duration of the monitoring program is dictated by the expected recurrence interval of the extreme event, but if in absence of extreme events (that is, extreme events are not expected for that species/population) we want to estimate "reliable" average survival and growth rates (which along with recruitment represent the main axes of variation in species' vitals rates and are essential for the development of any self-respecting model of population dynamics) is unclear for how long we need to go on with the monitoring program. I am not the first one to think about this problem in conservation biology, see for instance Chapter 23 of "Design and Analysis of Long-term Ecological Monitoring Studies" (many editors): "Choosing among long-term ecological monitoring programs and knowing when to stop" by Hugh P. Possingham, Richard A. Fuller, and Liana N. Joseph, or Gerber, L. R., M. Beger, M. A. McCarthy, et al. 2005. A theory for optimal monitoring of marine reserves. Ecol Lett 8, 829–837.

In practical terms, I was interested in estimating how stable were the estimates of average, maximum, and minimum (for a sampling interval) survival rates, and somatic growth rates (i.e., body growth) over time in populations of marble, brown, and rainbow trout living in Western Slovenian streams. Briefly, two populations of marble, one of brown, and one of rainbow trout were sampled bi-annually (June and September) between 2004 and 2014 (monitoring is still ongoing, but for various reasons in this study I only included data up to 2014). Those populations were not affected by extreme events since the start of the monitoring program. It is tricky to assess what's "stable" since we estimate rates or probabilities, thus we inevitably have uncertainty in the estimation, but let's put aside this thorny problem for a moment with the assumption we can at least qualitatively see or define "by look" what's stable or not.

Without getting deep into the gory details (and there are many), what I did was to fit capture-recapture models (fish were tagged when bigger than 115 mm) of survival and growth (using von Bertalanffy's growth models) with data available after 3, 4, 5 (and so on) years since the start of the monitoring program. For growth, I used two von Bertalanffy's models, one with random effects (see Vincenzi, S. et al. 2014 Determining individual variation in growth and its implication for life-history and population processes using the Empirical Bayes method. PLoS Comput. Biol. 10, e1003828) and one "classic", that is without individual random effects (I simply used the nls function in R, thus each data point is - wrongly - assumed to be coming from different individuals). For survival, I fitted models Phi(~1) (constant survival) and Phi(~time) (survival varying for each sampling occasion) with different models of probability of capture. With Phi(~time) models, I had the goal to estimate the maximum and minimum survival probabilities over sampling intervals (apart from statistical noise or use of different models of probability of capture, over time maximum survival probability for a sampling interval cannot become smaller and minimum survival probability cannot become bigger).

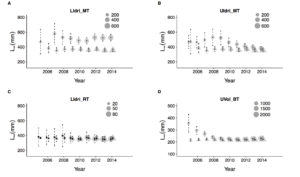
These are the results for growth, I took asymptotic length (of the average fish) as estimated response variable (estimates with classic nonlinear regression (dot symbol) and estimates with the model with random effects (triangle)), x-axis is the last year of sampling (for, say, 2006, I only keep the data for up to 2006, for 2010 up to 2010, and every time I re-fit models with the corresponding datasets). With the model with random effects, it takes 2 to 4 years to obtain a stable estimate. With the classic method, we need more years, and in some cases, the model gives wrong estimates, since outliers strongly pull the average growth trajectories in their direction (as I also discuss in the PLoSCompBio paper cited above and in another one currently under review). Vertical lines are standard errors of the estimate.

Estimates of asymptotic length using the classic method (dots) and the random-effects model (triangles). The size of symbols is proportional to sample size. LIdri_MT = marble trout in Lower Idrijca, UIdri_MT = marble trout in Upper Idrijca, LIdri_RT = rainbow trout in Lower Idrijca, UVol_BT = brown trout in Upper Volaja.

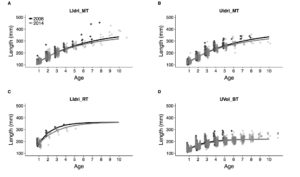
As I wrote in another paper currently under review: "The vBGF parameters can seldom be interpreted separately, especially when only a few older fish are measured; it follows that the analysis of the whole growth trajectories is necessary for understanding growth variation among individuals and cohorts". The second plot for growth shows the average growth trajectories using the random-effect models using data up to 2006 or up to 2014. Within populations and for all intents and purposes, the average growth trajectories are basically the same.

Average growth trajectories for the 4 salmonid populations estimated with data up to 2006 or up to 2014 with the random-effects model. LIdri_MT = marble trout in Lower Idrijca, UIdri_MT = marble trout in Upper Idrijca, LIdri_RT = rainbow trout in Lower Idrijca, UVol_BT = brown trout in Upper Volaja.

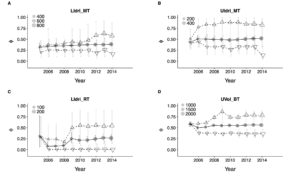
The last plot is about survival. x-axis is again the last year of simulated sampling, dot is the estimate of average survival, up triangle is the maximum estimated survival for a sampling interval, down triangle is the minimum estimated survival for a sampling interval. The estimate of average survival is very stable after just 2 or 3 years (4 to 6 sampling occasions), except for rainbow trout since the small sample size makes the estimate vary quite a bit, as expected.

Dots are average survival probabilities (Phi(~1)), up and down triangles are maximum and minimum survival for sampling occasion (max and min estimates of Phi(~time)). LIdri_MT = marble trout in Lower Idrijca, UIdri_MT = marble trout in Upper Idrijca, LIdri_RT = rainbow trout in Lower Idrijca, UVol_BT = brown trout in Upper Volaja.

The main point and message to take home from this work are that in salmonid populations 2 or 3 years of data may be enough to get "stable" estimates of survival and average growth trajectories, the latter only if using a random-effects model of growth, but > 5 years are needed to estimate maximum and minimum survival probabilities in absence of extreme events (and potentially longer for minimum survival probabilities, as it can be seen in the panels for LIdri_MT and UIdri_MT).

Interesting, surprising, useful, worthy of publication in a conservation journal such as Biological Conservation, Animal Conservation, Conservation Biology?


Posts on my academic life since 2004

Since my formal academic career is likely to end in a few months, I had this idea while on a car trip (San Francisco Airport to Santa Cruz, if you are interested in geographic details) of writing about my academic and research experience since 2004, the year I started my PhD in Theoretical Ecology at the University of Parma, Italy. I believe my experience has been original and interesting, and despite not having been successful in securing a permanent position (or maybe because of it), I am confident I can share valuable insights for young researchers or people outside of academia who want to understand how things work, or might work better. I also have some beautiful pictures to share.

Some brief biographical details. I am 37 years old, I do research in mathematical biology, ecology, and evolutionary biology, I won international grants and awards (in particular a Marie Curie International Outgoing Fellowship, which I started in January 2013 and finished in December 2015), I recently toured South America giving talks on my research in mathematical biology, and I have published so far 30 peer-reviewed papers (43 in total, 3 others in which I am the first author are currently under review, other 2 I may or may not write), and almost one year ago (April 25th 2016, a date that is easy to remember since it is the day in Italy in which the defeat of nazi-fascism is celebrated and remembered, la festa della Liberazione) I received a self-sponsored US Green Card for extraordinary abilities in the Sciences. I live in Santa Cruz, CA, and I have been residing here since June 2010, with a six-month interruption between December 2010 and June 2011. I have loved very much studying, learning how to think and communicate, carrying out my research, giving talks, teaching, traveling the world.

New paper accepted for publication by PRSB

A new manuscript I wrote with my long-term colleagues Marc Mangel, Dusan Jesensek, Carlos Garza, and Alain Crivelli has just been accepted by the Proceedings of the Royal Society B.

This is the cover letter, in which I explain the high-level picture and some details of the analyses (it may help some junior scientists still struggling with cover letters, too much, too little, too many details or not enough etc.).

Cover letter

Santa Cruz, 09/26/2016

Dear Editor,

We are pleased to submit our manuscript “Genetic and life-history consequences of extreme climate events” to PRSB.

The climate change-induced increased frequency and intensity of extreme climate events is one the major threats to the persistence of species. However, when dealing with extreme events, finding the right model system, posing and testing tractable hypotheses on their demographic, genetic, and life-history consequences, and developing an overarching predictive framework is very challenging. First, climate extremes are rare events, and as a consequence most of the empirical studies on their effects have been opportunistic and anecdotal. Then, the demographic, genetic, and life-history effects of extreme climate events are not easily predictable or generalizable across species or habitats, especially when the investigations are not guided by ecological and evolutionary biology theory.

In this work, we test – to our knowledge for the first time - theoretical predictions on the demographic, genetic, and life-history effects of extreme climate events on two populations of a fish species. The two populations have been drastically reduced in size by flash floods that occurred in 2007 and 2009. We used a statistically sophisticated approach that included reconstruction of pedigrees using long-term tag-recapture data (1995 to 2014 from one population, 2006 to 2014 for the other) and genotypes of more than 1,800 unique fish. In particular, we tested for faster life histories, higher variance in reproductive success, and loss of genetic variation after the extreme climate events.

We are confident that our study significantly advances our understanding of the demographic, genetic, and life-history effects of extreme climate events on natural populations and would be of great interest to a broad audience of biologists.

And here below is the abstract (I will soon post the pdf in the Publications page of the website).

Abstract

Climate change is predicted to increase the frequency and intensity of extreme climate events. Tests on empirical data of theory-based predictions on the consequences of extreme climate events are thus necessary to understand the adaptive potential of species and the overarching risks associated with all aspects of climate change. We tested predictions on the genetic and life-history consequences of extreme climate events in two populations of marble trout Salmo marmoratus that have experienced severe demographic bottlenecks due to flash floods. We combined long-term field and genotyping data, and pedigree reconstruction in a theory-based framework. Our results show that after flash floods, reproduction occurred at a younger age in one population. In both populations, we found the highest reproductive variance in the first cohort born after the floods due to a combination of fewer parents and higher early survival of offspring. A small number of parents allowed for demographic recovery after the floods, but the genetic bottleneck further reduced genetic diversity in both populations. Our results also elucidate some of the mechanism responsible for a greater prevalence of faster life histories after the extreme event.

Further considerations (some self-congratulatory)

These are some thoughts that I shared with one of my colleagues via email before submitting a revised version of the manuscript.

"Brief thoughts. This paper is an example of interdisciplinary work. There is solid life-history theory, we built up from previous work thus giving the sense of solid foundations and a on-going narrative, some hard tests as envisioned by Platt (age at reproduction decreases or not after the floods), demography, classic genetics, and state-of-the-art pedigree reconstruction.

Let's hope it gets accepted as is and we can then congratulate ourselves on an excellent, original work I am very proud of."

New pre-print

Pre-print of my last work is on biorxiv

Vital rates, source-sink dynamics, and type of competition in congeneric species

Simone Vincenzi, Dusan Jesensek, Alain J Crivelli

Abstract

The estimation of vital rates and life-history traits and how they vary with habitat and population factors are central for our understanding of population dynamics, risk of extinction, and evolution of traits in natural populations. We used long-term tag-recapture data and novel statistical and modeling techniques to investigate how population and environmental factors determine variation in vital rates and population dynamics in the population of brown trout Salmo trutta L. of Upper Volaja (Western Slovenia). Alien brown trout were introduced in the stream in the 1920s and the population has been self-sustaining since then. The population of Upper Volaja has been the subject of a monitoring program that started in 2004 and is currently on going. Upper Volaja is also a sink, receiving individuals from a source population living above an impassable waterfall. We estimated the contribution of the source population on the sink population and tested the effects of temperature, population density, and early environment on variation in vital rates and life-history traits among more than 4,000 individually tagged brown trout that have been sampled since 2004. We found that fish migrating from the source population (>30% of population size) help maintain high population densities despite poor recruitment. Neither variation in density nor in temperature explained variation in survival or growth; the best model of survival for individuals older than juveniles included cohort and time effects. Fast growth of older cohorts and higher population densities in 2004-2006 suggest very low densities in early 2000s, probably due to a flood event that caused a strong reduction in population size. Higher population densities, smaller variation in growth and weaker maintenance of size hierarchies with respect to endemic marble trout suggest that exploitative competition for food is at work in brown trout and interference competition for space is operating in marble trout.

Data is here

I will provide the R code soon

Floods causing demographic and genetic bottlenecks

I am currently working on testing hypotheses on the effects of flood events causing massive mortalities on reproduction, survival, and growth of marble trout; more in general, I am testing the effects of massive mortality events on the adoption/evolution of life histories.

Here is a schematic representation of the model system and the processes I am investigating that I have been using in some of my recent talks, more a narrative than a paper Introduction.

Tagging and sampling of marble trout populations started in 1996 and 1998 for Zakojska and Gacnik (with the introduction of the parental cohorts in the streams, see previous post), respectively, in 2002 in Huda, in 2004 in Lower Idrjica and Upper Idrijca, and in 2006 in Studenc, Lipovesck, Trebuscica, and in 2008 in Svenica. Apart from Zakojska and Gacnik, in all the other populations the estimation of density started years before the start of the tagging study.

Allpoproadmap

We estimated density of fish older than 0+ (i.e. fish that survived the first winter) using a two-pass removal at each sampling occasion.

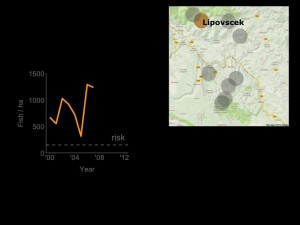
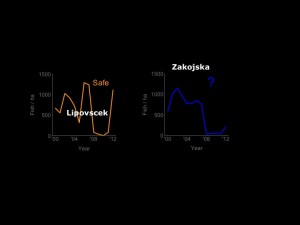
Let's have a look at the population dynamics of two marble trout populations. The population of Lipovesck was doing fine after the start of the monitoring program...

Lipo1

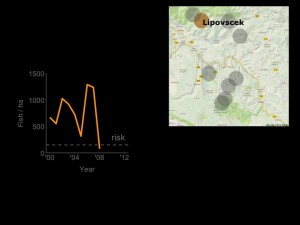
but between 2007 and 2008 there was an episode of massive mortality.

Lipo2

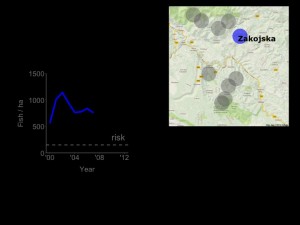
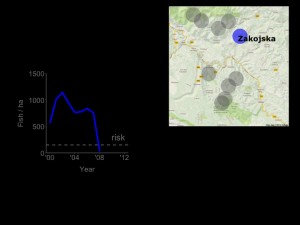
Also the population of Zakojska was doing fine...

Zak1

but also in this case we observed an episode of massive mortality between 2007 and 2008.

Zak2

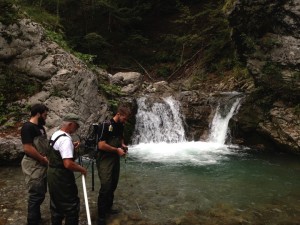
It turns out that the streams in which marble trout live are quite mellow and peaceful most of the time, but sometime they are affected by flash floods and debris flows. Flash floods and debris flow occur in the area in which marble trout live causing substantial damages to infrastructures, and death or downstream displacement of trout. Flash floods are characterized by very short time scales (less than a few hours), stream discharge quickly goes up and quickly goes down, and mean daily water discharge may be a very poor indicator of the occurrence of a flash flood. The area in which marble trout live receives more than two times the average annual Slovenian rainfall and it is one of the wettest regions of Europe. Flash flood in Western Slovenia tend to occur from September to November, but in the last few years they also occurred in the Spring.

Flood pic

At this point you might want to know what happened to the populations of Lipovesck and Zakojska.

The population of Lipovesck was affected by another flood event in 2009, but it recovered thanks to a massive production of young in 2011. The population of Zakojska is on the way back, but the surviving fish were located only in two section of the stream, while before the flood the entire stream was inhabited by marble trout; thus, the recovery is expected to be slower than in Lipovesck.

LipoZak

Topography also plays a role. In Lipovesck, we were monitoring and sampling only the lower part of the stream,  but above a 1.5 to 2 m-tall waterfall there were fish alive after the flood that contributed to population recovery (e.g., most of the young born in 2011 were probably produced upstream).

Lipo_stream

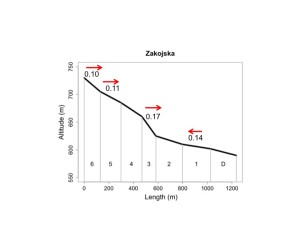
In Zakojska, some sectors are isolated (fish can move down, but not up). Fish can move up only from sector 4 to 5, and from 1 to 2. After the flood (in 2008, 2009) fish were alive and present only in sector 5 (thus sector 6 is lost since there are no chances of spontaneous colonization - no fish above sector 6) and in sector D (downstream). Numbers above sectors in the figure below are point estimates of annual probability of moving from one sector to another (data pre-2008, estimated using MARK).

Zak_stream

What happens when a flash flood or debris flow occur?

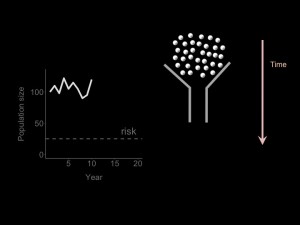
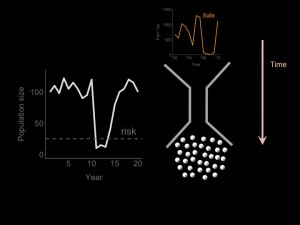
This is an illustration of a population bottleneck. Each marble is an individual or a group of individuals in a population.

Bott1

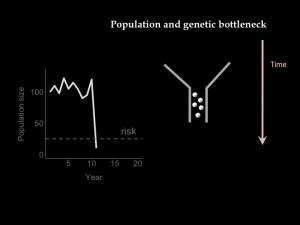
At some point, an environmental extreme event such as an earthquake, flood, fire, drought, cause a sharp reduction in population size, i.e. a population bottleneck. Just a few individuals are able to pass through the bottleneck. This event has demographic consequences by reducing the number of individual alive and genetic consequences by very likely reducing the genetic diversity of the population, since just a fraction of the original genetic diversity is expected to be present after the population collapse.

Bott2

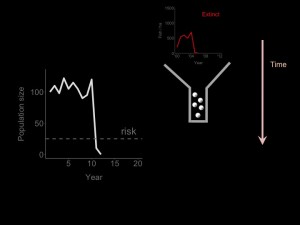
If there are no individuals left, or the few that survived are not able to produce a strong-enough cohort of young, that population is likely to go extinct.

Bott3

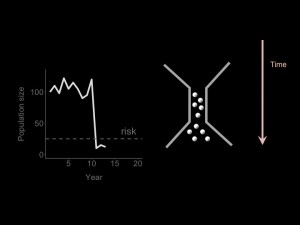
In other cases, the individuals passing through are the among the most fit individuals in the population or have particular traits that help them reproduce successfully or are just able to reproduce and produce a strong-enough cohort of young by chance.

Bott4In that case, the population bounces back to safe abundances, as in the case of Lipovesck.

Bott5

---------------------------------

I am currently finalizing the pedigree reconstruction for the populations of Lipovesck and Zakojska, using 77 and 94 population specific SNPs, respectively. The use of SNPs was necessary as marble trout populations present low to absurdly low genetic diversity (for one population - Huda - we almost found no "usable" polymorphisms" despite multiple DD-RAD runs). In particular,  I am testing differences in allelic diversity before and after the flood (expected a decrease after the flood), differences in life histories (expected faster growth and younger age at first reproduction after the flood), differences in survival (expected higher survival after the flood due to relaxation of density-dependent pressure). The hypothesis-testing analyses will be accompanied by analyses that are more exploratory in nature, such as traits of successful reproductors, movement of young after the flood, variance in parents per offspring,

I will soon post updates on the study.

Correlation between stream temperatures in Slovenian streams in which marble trout live

This is an update on my research and I will try to post more often in these last months of my Marie Curie Fellowship. Files are hosted on my github page. Data have been collected by Alain Crivelli and Dušan Jesenšek since 1996. Some info on marble trout, the conservation program, and Western Slovenian streams here below.

1. Marble trout and Western Slovenian streams

Marble trout is a freshwater resident salmonid endemic in the Adriatic basin of Slovenia. Whether there are still pure marble trout populations living in the Po river system (Northern Italy) is subject of current research. Marble trout live in streams with mean summer temperature below 15°C and winter temperature ranging from 0 to 5 °C. Marble trout spawn in November-December and offspring emerge in May-June.
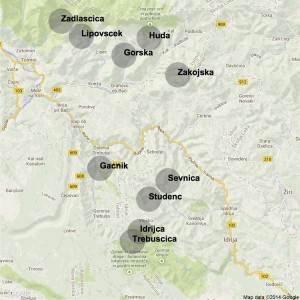
The Marble Trout Conservation Program started in 1993 in the upper reaches of the Soca River basin and its tributaries - the Idrijca and Baca Rivers - in Western Slovenia. Eight pure marble trout populations, all isolated and separated from the downstream hybrid marble-brown trout zone by impassable waterfalls, live in headwater streams in the basins of Soca, Baca, and Idrijca Rivers: Huda, Lower Idrijca, Upper Idrijca (in the map below Lower and Upper Idrijca are grouped together), Lipovesck, Studenc, Svenica, Zadlascica, Trebuscica.
Other two populations (Zakojska and Gacnik) have been created by translocating the progeny of the Zadlascica (Zakojska) and Trebuscica X Lipovesck (Gacnik) in 1996 and 1998, respectively.

DSCF2672

DSCF3188
 Allpoproadmap
2. Analyses

For some of the analyses I intended to carry out (temperature-dependent survival, growth, and recruitment), it was necessary to have complete temperature records for all streams since the start of the sampling. However, there were some missing data (sometimes whole seasons/years) in evert stream. The temperature .csv files are (stream_name)_temp.csv, the first column is the Date, the second is the mean daily temperature (Temp). Start by sourcing the file Temp.r, which is reading all the temperature files and merging them together (r scripts are here).

source("Temp.r")

The output temp.all.df (along with the production of a ten-panel plot with stream-specific monthly temperature boxplots for 2009-2013) is a data.frame with columns Date, Temp, Year, Month, Stream, Calc (Meas = temperature has been recorded, see below for other values) (see below).

Temperature_boxplot

Daily Water Temperature (C)
Date Temp Year Month Stream Calc
1996-07-04 10.98 1996 7 Zak Meas
1996-07-05 10.99 1996 7 Zak Meas
1996-07-06 11.26 1996 7 Zak Meas
1996-07-07 11.19 1996 7 Zak Meas
1996-07-08 11.06 1996 7 Zak Meas
1996-07-09 9.96 1996 7 Zak Meas
1996-07-10 9.85 1996 7 Zak Meas
1996-07-11 10.07 1996 7 Zak Meas
1996-07-12 10.51 1996 7 Zak Meas
1996-07-13 11.08 1996 7 Zak Meas

Then, I tested the correlation between stream temperatures between pair of streams (one is the target - the one with missing data - and the other is the tested). I used the temperature data of the tested stream with the highest correlation with the temperature data of the target stream to impute the missing temperature data in the tested stream.
The Temp.corr.f function tests the correlation between water temperature data recorded in different streams.

source("Temp.corr.r") # contains Temp.corr.f
Temp.tb = Temp.corr.f(temp.all.df)

The Temp.tb data.frame has columns target stream (tar), tested stream (var), correlation between stream temperature of the two streams (cor), years with common number of days with temperature recorded (common.years), years with missing data for the target stream (miss.years), and years with missing data for the target stream, but with complete data for the tested stream (miss.in.var). The years in miss.in.var can thus be used to impute the missing data.
The correlation between water temperature of streams are typically very high (mean correlation[sd] = 0.97[0.01]).

Correlation of water temperature
tar var cor years.cor common.years miss.years miss.in.var
Zak Gac 0.95 5 2001-2002-2005-2009-2013 1996-1997-1999-2000-2006-2008-2010-2011-2014 2006-2008-2010-2011
Zak Sve 0.95 3 2002-2009-2013 1996-1997-1999-2000-2006-2008-2010-2011-2014 2006-2008-2010-2011
Zak Stu 0.97 3 2005-2009-2013 1996-1997-1999-2000-2006-2008-2010-2011-2014 2006-2008-2010-2011
Zak LIdri 0.97 3 2005-2009-2013 1996-1997-1999-2000-2006-2008-2010-2011-2014 2006-2008-2010-2011
Zak UIdri 0.96 3 2003-2005-2013 1996-1997-1999-2000-2006-2008-2010-2011-2014 2006-2010-2011

In each stream, I imputed the missing data (1) using the temperature data from the tested stream with the highest correlation with the target stream and (2) by applying the best model (linear or non-linear - gam -, chosen according to best prediction) linking the water temperature data of the two streams. The r script for imputing missing data is in Temp.filling.r.

source("Temp.filling.r")

The output of the script is the data frame temp.all.df with columns: Date, Temp, Year, Month, Stream,
Calc (Meas = temperature recorded in the stream, Gac2005 = in one year (1997) we had missing data for Gac and the only acceptable data for imputing was coming from Gac in 2005, Same_as_a = Same temperature as days after (just for a few days missing), Same_as_b = Same temperature as days before (just for a few days missing), Zak2012 = in one year (1997) we had missing data for Zak and the only acceptable data for imputing was coming from Zak in 2012, Stream_name = stream whose temperature data was used to impute missing data, degree_days = degree days for the day using 5C as base temperature, Sampling_Season = Summer for June, July, September - Winter for the rest of the year). Sampling occurred either in June or September or in both.

Daily Water Temperature (C)
Date Temp Year Month Stream Calc degree_days Sampling_Season
2006-08-19 13 2006 8 Stu Meas 7.8 Summer
2006-08-20 13 2006 8 Stu Meas 7.8 Summer
2006-08-21 13 2006 8 Stu Meas 8.1 Summer
2006-08-22 13 2006 8 Stu Meas 7.6 Summer
2006-08-23 13 2006 8 Stu Meas 7.6 Summer
2006-08-24 12 2006 8 Stu Meas 7.3 Summer

Temperature data is now ready to be used to test differences in water temperature between streams, and temperature-dependent survival, growth, and recruitment.

Slides of a recent talk I gave at the Hopkins Marine Station (De Leo's lab)

Slides of a recent talk I gave at the Hopkins Marine Station; I was invited by my former PhD supervisor Giulio De Leo.

Title

Eco-evolutionary responses to extreme events

Reference paper

Extinction risk and eco-evolutionary dynamics in a variable environment with increasing frequency of extreme events

Slides (some colors are missing for unexplained reasons)