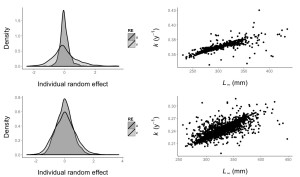
How long does it take to make this graph (click to enlarge)?
Yesterday it took one hour and a half. I used the R package ggplot2, which allows for a greater control on all the various plot components, from legend, to points, to lines, than the standard plot libraries (ggplot2 is great and a good fun, by the way). However, ggplot2 is is very verbose and not intuitive (at least for me). Plot quality is very nice, though. The figure above is one of the figures in the soon-to-be-submitted paper on a novel approach to estimate individual variation in biological processes, in this case body growth of fish using the von Bertalanffy growth function (I will explain how the two parameters are positively correlated in a later post). Top row is one fish populations, and bottom row another one.
Anyway, is one hour and a half too much for a single figure? Consider that I am quite skilled with graphs (even if I could not delete the annoying diagonal line in the legends of the density plots - Illustrator will help -, and I still don't know whether is better to use common y-and x-scales for the two populations) and I don't waste much time (I am quite the perfectionist, that's the only problem). I don't know, Hans and I have worked for quite a long time on the process model (in weeks, not in hours), so maybe this is time well spent, even it takes time from doing some more "important" stuff (like actually solving problems, same thing for writing this blog post now that i think about it).
